

Would you like a Free Vacation? Scroll down to “Subscribe here” and follow the prompts.
Success in trading comes from the ability to discover opportunities at a glance before they occur.
That way you can take advantage of market moves before these opportunities occur and achieve significant potential returns.
Buying stocks at such times can deliver considerable profit opportunities.
Financial returns can be increased even more by using the leverage of options.
ReliableOptionIncome.com (ROI’s) system of delivering reliable income from trading options include the following features:-
- ROI’s short term returns, averaging 14 days, have consistently exceeded 100%.
- Trading options may seem difficult at first if you have never traded options before; so we have covered this extensively in the ROI Guide which provides simple and easy to follow instructions for setting up option trades.
- Many of the weekly option trade examples require a small investment of $150 or less. All trade examples have a reward to risk ratio of more than 100%. So for every $150 invested the expectancy is that this will double to $300 or more in the short term.
- Minimizing risk is very important, so the risk is never more than the investment; thus the most you can lose in a $150 option trade is $150.
- ROI is not about creating massive wealth overnight. It is about delivering regular wins to consistently grow your trading capital.
- We recommend that you start small and increase your investment per trade as you build confidence.
The foundation of ROI’s system is that a number of stocks repeat well defined price patterns at certain times of the year.
As an example, if a stock has moved up an average of 5% in 18 of the past 20 years from 23 November to 7 December that presents a trading opportunity when the date nears Tuesday 23 November 2021.
This is where the education provided by ROI comes into its own.
ROI is about using options to achieve above average returns by taking advantage of price patterns which are repeated year after year.
In a recent month 7 out of 10 trades achieved returns of more than 100% while there were 3 losses.
An investment of $150 (on average) in each of these 10 trades cost $1,500 and returned $2,120, a profit of $620, equal to a 41% increase in one month. A similar result is expected for this forthcoming month, based on past probabilities.
ROI’s strategy is simple, easy to follow, rules based, reliable and very effective.
The New York Stock Exchange is the largest in the world with an equity market capitalisation above $25 trillion and more than 2,000 listed stocks. Next is NASDAQ with over 3,000 listed stocks (followed by the London SE and then the Tokyo SE).
At ROI we analyzed a large number of stocks to find price patterns which can be exploited for profit. We analyzed data going back more than 20 years.
This extensive analysis resulted in a list of “select” stocks that exhibited repetitive price patterns at certain times of the year.
In particular, we analyzed NYSE and NASDAQ stocks and ETF’s for price patterns within 7 day, 14 day and 30 day periods.
The 7 day period was selected to make use of opportunities offered by stocks with weekly options.
There are almost 500 stocks and some 100 ETF’s with weekly option series.
Weekly options are similar to monthly options, except they expire every Friday instead of the third Friday of each month. Weekly options have become extremely popular for trading, allowing traders to capitalize on short-term opportunities.
The 30 day period was selected for stock price patterns that occurred over one month, to fit in with traditional monthly option expirations while the 14 day stock price patterns were selected as a timeframe in-between the weekly and monthly option expiration periods.
The main objective of ROI is to deliver above average returns on a consistent and reliable basis with the use of options.
Trades that were recently suggested delivered the following results:-
Stock code | Direction | Returns |
(on average 14 days) | ||
CI | Bullish | more than 100% |
HPT | Bullish | more than 100% |
DE | Bullish | more than 100% |
PBR | Bearish | a 100% loss |
PG | Bearish | more than 100% |
MO | Bullish | more than 100% |
PG | Bullish | more than 100% |
ZION | Bearish | more than 100% |
UNH | Bullish | more than 100% |
The successful ROI strategy was developed by two colleagues:-
Robert Jongebreur and Jignesh Joshi.
ROI was founded by Robert Jongebreur. Robert has an engineering and science background and completed his Masters in England. He has lived and worked in six countries including USA, and is based in Melbourne, Australia. After a career in banking and finance including a period as the founding MD of a stock exchange listed investment company he moved to business consulting. Robert is fascinated with option strategies and over the past two decades has tried out a host of option strategies from iron butterflies, to Elliott Wave, to Ichimoku Cloud and many others. After many trials of various strategies he came back to the simple but successful ROI strategy based on probabilities.
Jignesh Joshi has a strong background in mathematical modelling and together with Robert developed the formulas and macros needed to analyze large amounts of data on the NYSE and NASDAQ exchanges. Jignesh is based in Mumbai, India and has worked as an Operational Manager for several large European and USA companies. The two colleagues have worked together over the past five years and are assisted by several consultants for day to day support.
ROI is based on the simple, proven strategy that above average returns can be achieved by buying and selling stocks based on repetitive price patterns and that the prudent use of options can magnify these returns.
What can at times be hard to appreciate is that high probability trades (HPT) happen regardless of other events that inevitably occur over the years.
Take a stock which increased an average of 5% in price in 18 of the past 20 years from 23 November to 7 December. This statistic (90% probability) held true regardless of other events that occurred.
So this statistic holds true despite large market fluctuations (such as occurred during the GFC), some 80 quarterly earnings reports, stock splits that might have occurred, payment of dividends, including Presidential elections every four years from 2000, as well as major economic events that would have happened over those 20 years.
At ROI we believe that a successful trading system should be easy to follow, that it should be based on simple rules and that it should deliver profitable results on a regular, reliable basis.
There are more than 100 technical indicators that investors can use for guidance in making a trading decision. Additionally there is a host of economic data released every week while the business pages deliver a never ending stream of company news plus there are numerous commentaries from market pundits. No wonder that investors can get confused.
The market tries to digest a massive amount of information each and every day. This can be overwhelming.
While not entirely disregarding the plethora of information available, ROI’s view is simply that its analysis is based purely and simply on probabilities.
Thus, going back to the earlier example, a stock with a 90% probability of moving higher from 23 November to 7 December did so over the past 20 years despite the fact that a number of these events were occurring regularly and simultaneously as a “backdrop”.
ROI’s approach is that a decision to trade can be as simple as “will I buy shares, or options, in stock XXX which in two days time shows a 90% probability of moving higher in the following 7 days”?
One of the benefits of options is that 1 contract allows the investor to control 100 shares of stock.
The maximum loss in a long call or long put is the amount invested. An option account can be set up with as little as $500.
If the option costs $1.50, equal to $150 per contract, plus a small amount of commission, this allows the investor to purchase 3 different contracts of 3 different stocks at different times before the $500 is fully invested. However, it is highly unlikely that buying 3 such contracts, each where the stock has a 90% probability of moving higher (or lower for a put), will result in a loss on each of those 3 contracts. Based on probabilities, the upside is considerable while the downside is small.
ROI Members are provided with a list of 10 stocks each month that are likely to move up (bullish) with a probability of more than 80% or a probability of more than 75% of moving down (bearish).
Probabilities can be as high as 90% or 100% with this information displayed in a graphical format on an ROI Graph as shown below.

The above illustration shows the ROI Probability Graph for ISRG (Intuitive Surg Inc) with a number of %’s inside horizontal bars for October 2021. The ROI Score is the highest % found in a blue bar. For October this was 91% starting 26 October.
The colors of the horizontal bars range from light blue, to mid blue and a dark blue indicating 7, 14 and 30 day bullish opportunities based on probabilities.
On 10 October 2021 the ROI Graph indicated a 82% probability of the stock moving higher over the next 30 days from 10 October. In 2021 this was a Sunday thus a trade would be entered on the preceding Friday or the following Monday October 11.
The following is the stock chart for ISRG for October 2021.
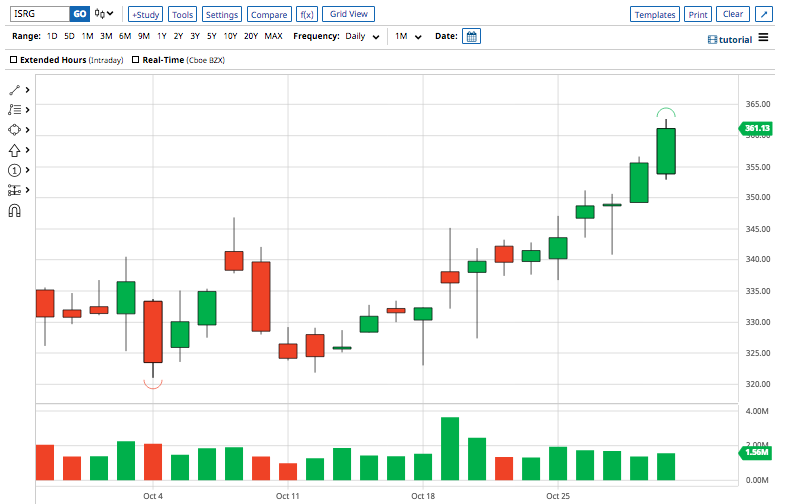
Note the low for the month on October 11. Thus the 82% probability from that date (of the stock moving higher) was remarkably accurate. Again, the ROI Graph indicated that the stock would also move higher from 26 October. In fact it moved considerably higher over the next few days thus providing good gains for a bullish options trade.
Will ISRG do this again in October 2022? No one knows. Based purely on probabilities it is highly likely that it will. A word of warning – this is not a guarantee.
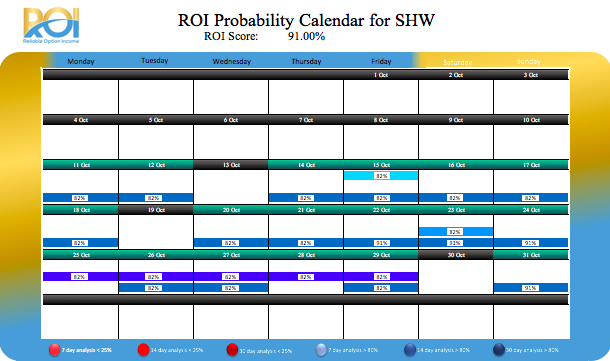
The illustration above shows the ROI Graph for SHW (Sherwin-Williams Company) for October 2021.
This indicates that SHW has a high probability of moving higher from around 15 to 18 October 2021. This is exactly what happened, as shown on the following stock chart.
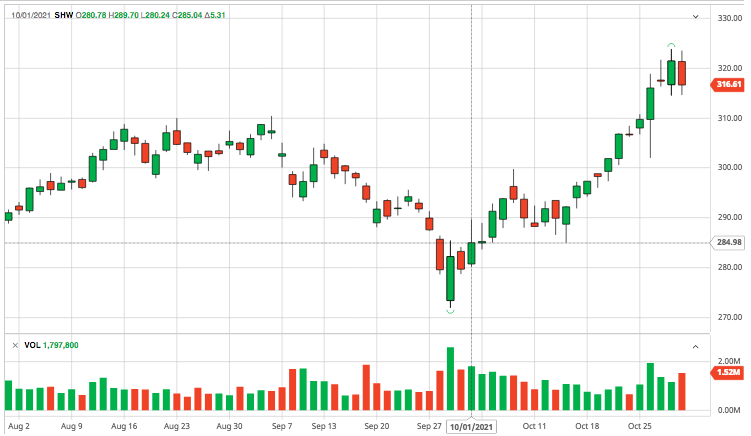
The illustration above shows the stock chart for SHW for October 2021. Note how the stock moved more than 10% higher from mid to end October, presenting a tremendous opportunity for a bullish option trade.
The illustration below shows the ROI Graph for TER (Teradyne Inc) for October 2021.
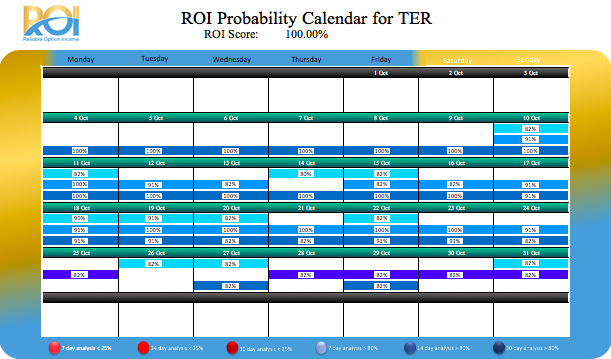
The ROI Graph indicates very high probabilities (some 100%) of TER moving higher from 11 October 2021 to the end of the month (and possibly longer).
The chart below shows the price chart for TER for the 3 months to end October 2021.
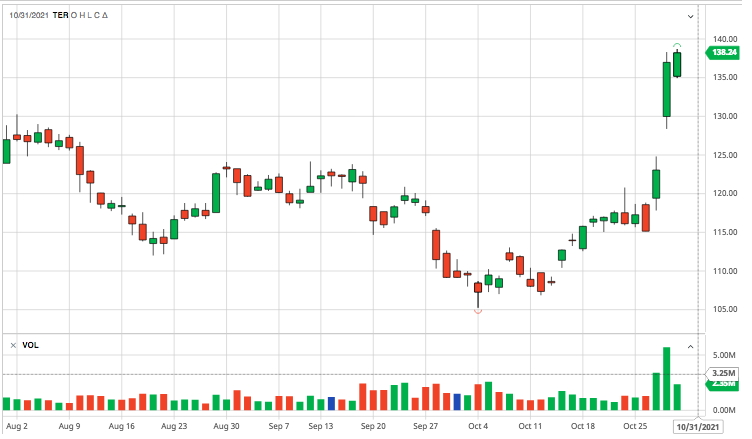
The 3 months stock price chart for TER shows it moving lower from the beginning of August but then moving higher from mid-October 2021. That was indicated by the ROI Graph and that is exactly what happened.
TER moved from $108 on 11 October to $138.24 on the last trading day of the month (October 29 2021). That is massive move of 28%.
Members are provided with a list of 10 HPT stocks each month. In addition, a recommended option trade setup is provided for each stock. Setups are typically bull call spreads as this reduces the cost per trade.
In instances where the ROI Graph shows highly bullish patterns, a bullish call way OTM trade setup could also be suggested. A $150 call option with 17 December expiration placed on 26 October at a cost of $80 would have returned $755 if exited 2 days later on 28 October. That represents a gain of 844% in just 2 days.
The “ROI Guide to High Probability Trades using Options” provides detailed information on trade setups for beginners as well as more experienced option traders.
This Guide is provided to all Members when they join.
Subscription to the monthly list of 10 High Probability Trades is $27 for the first month and only $99/month after that.
To secure your Free Vacation with a 3 months membership, click on the button below and follow the prompts.
Chapter 3 “How to interpret the ROI Calendar & the ROI Score “ is required reading. This chapter is about selecting the right option series, preferred strikes, expiration dates and risk/reward payoffs. The Guide is informative and simple to follow, suitable for both the novice option trader as well as the more advanced option trader.
The market is always full of “noise” and it can be confusing at times to listen to contradictory statements from any number of sources. One benefit of the ROI system is its simplicity. Another benefit is that it looks forward to the week and month ahead and doesn’t worry about the vast mounts of commentary and analysis of what has been happening in the past few days or in recent weeks.
Trading is mainly about following a system. A system that suits your trading style. A system that works. And once you have found a system that works then stick to it. If it is simple and it works, such as ROI, there is no need to complicate it.
Trading options does not need to be complicated.
ROI is a system based on high probability trades. We cannot predict the future. The past is imperfect but it is the best guide we have. Hence, if a stock moved up in 18 of the past 20 years from one particular date to a later date that does not mean it is guaranteed to move up this year when that same date comes around. But based on probabilities there is a high chance but again no guarantee that it will do so this year from that same date.
There is a saying in the market “a rising tide lifts all boats”. Thus a bullish trade is likely to do even better when the overall market (typically the SPY) is bullish and the opposite is true as well i.e. a bearish trade is likely to do even better in a bearish market.
At times the market can gyrate wildly, swinging from large gains to large losses in a matter of days. To counteract this we like to have bullish and bearish High Probability Trades open at the same time. In normal times when the market is ranging in a fairly narrow band both the bullish and bearish trades, based on probabilities, should deliver a profit. However, if there is a large unexpected market swing, in either direction, profit on the bullish trade should exceed a possible loss on the bearish trade and vice versa, thereby protecting the overall positions. This is covered in more detail in the ROI Guide.
The price of membership is $99/month which can be covered by just one successful high probability trade in a month.
The ROI Guide provides invaluable information about options, option series, strike prices, and the selection of call and put spreads. You get immediate access to the guide after becoming a Member. The ROI Guide alone is worth several months of Membership
Benefits of ROI membership include:-
• Members are provided with 10 High Probability Trades each month, averaging 2 or more HPT’s per week
• Members are provided with valuable educational materials and trading
guides
• Members are provided with simple to follow guides on selecting the best
option series
• Members are provided with simple but important rules for managing risk
• Dedicated support is available to answer questions from Members.

My favorite trading strategy of all time is trading High Probability Trades using options.
Here’s a unique opportunity to test-drive it!
Here’s how it works…
The HPT strategy has the potential to find stocks that other traders are missing.
Several option trades doubled and even trebled in price in a short period of time. Some in less than 1 week.
(Note: Past performance is no guarantee of future results. Trading options involves risk and is not suitable for everyone).
To help traders take advantage of the new market environment, I’m offering a way to try the HPT strategy for a shorter subscription term.
The normal list price to become a Member of the HPT strategy is $99 per month.
Which is a GREAT deal considering the number of trades and potential profit.
But for TODAY, I’m authorizing some serious savings…
You won’t pay $99.
You won’t even pay $59.
Because I’m making the HPT strategy available for the “irresistible” price of just $27!
You heard that right. Just $27 gives you complete access to ROI’s HPT recommendations for the next 30 days… and you get to keep the “ROI Guide to High Probability Trades using Options”.
Click on the button below to Get 30 Days of HPT recommendations for Just $27!
Over the next 30 days we will issue an average of two call or put options each Saturday, ready for the market on Monday, often with updates during the week.
I understand when you say ”I want it but I would like to try it first”.
I get it.
This is a very simple 1 month subscription offer. There is absolutely no commitment beyond this first month.
If you decide that ROI’s HFT strategy is not for you then simply notify us within the first month to cancel your subscription. We will then thank you for giving it a try.
Thank you for subscribing to ROI’s HFT strategy for the next 30 days at less than $0.90/day.